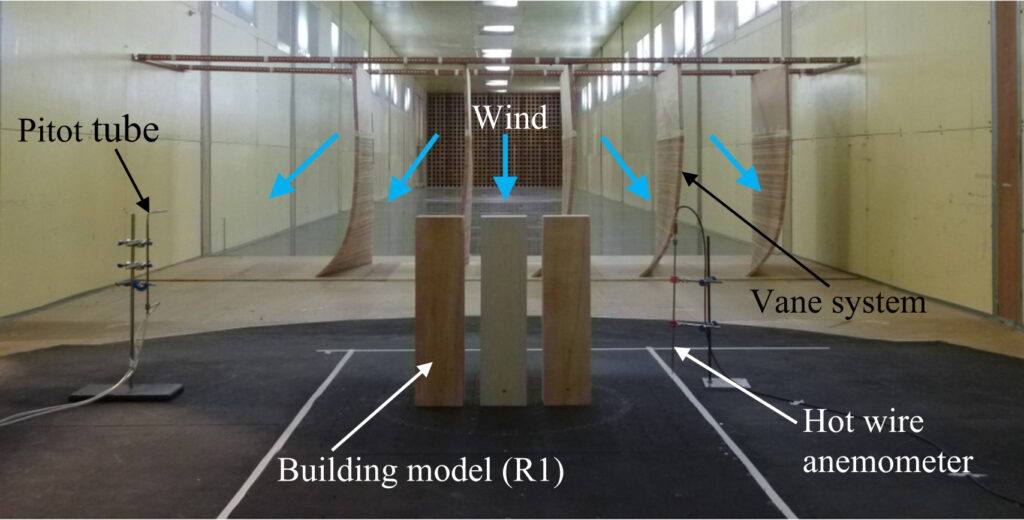
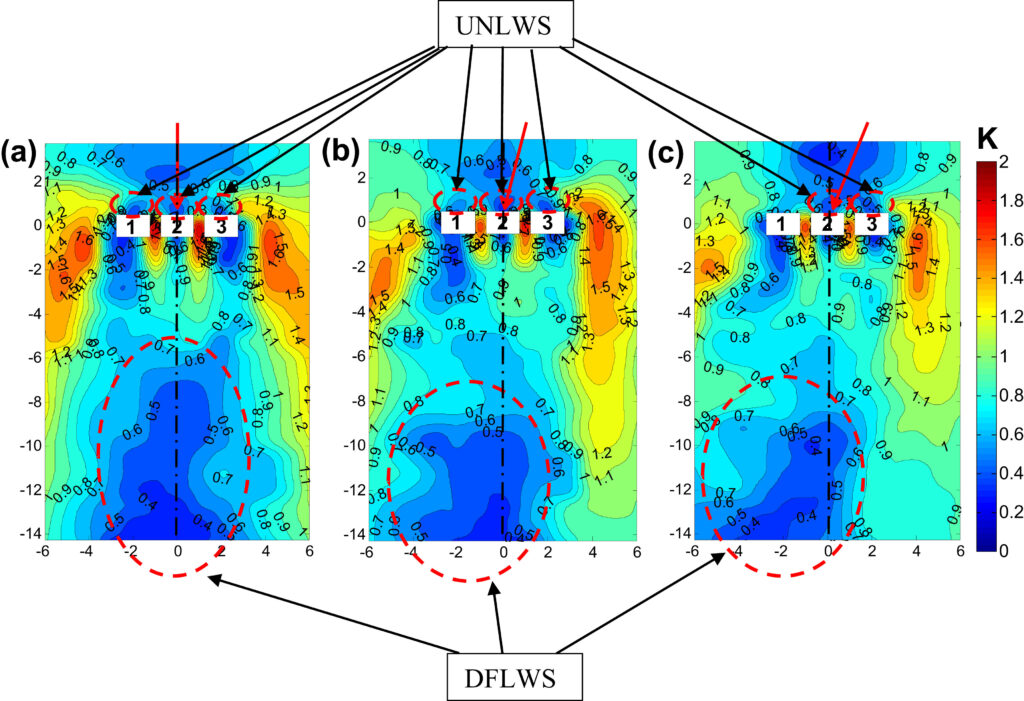
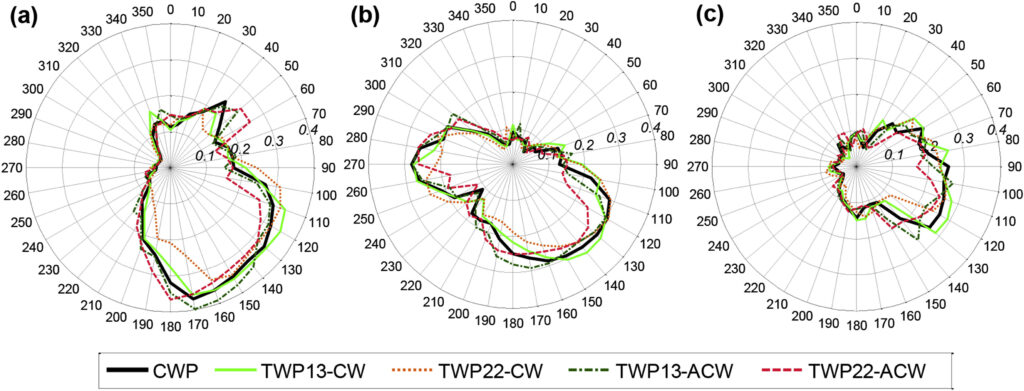
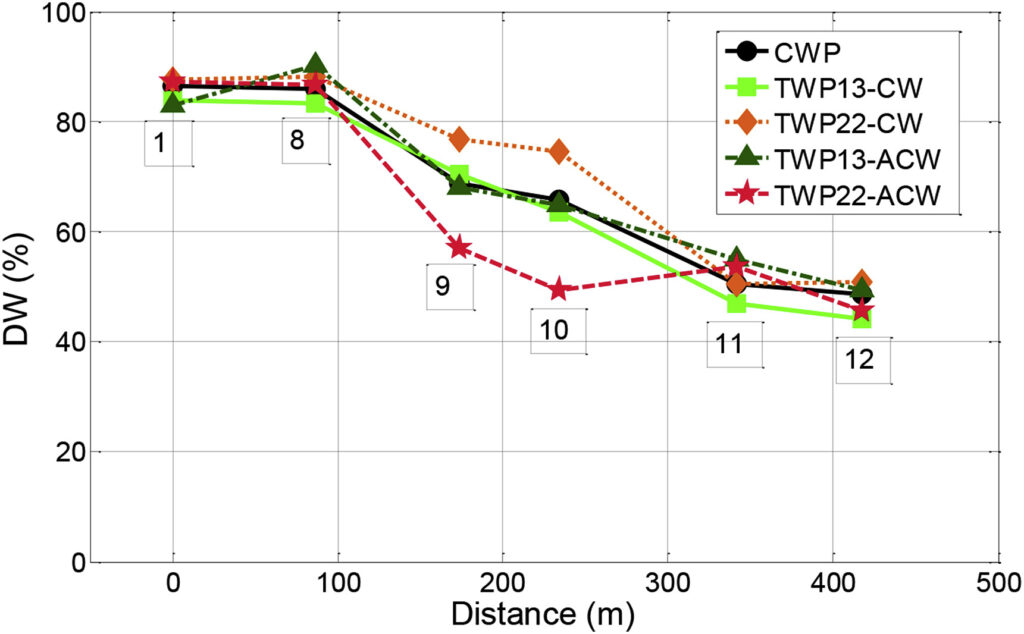
Pedestrian-level wind environment near isolated buildings under twisted wind flows
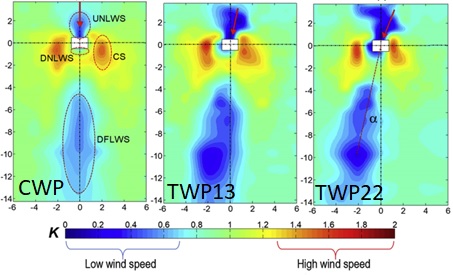
The influence of twisted wind flows on pedestrian-level wind environments was demonstrated by using two twisted wind profiles (TWP) in a boundary layer wind tunnel. Simulated wind profiles had maximum yaw angles of 13° and 22° to represent ‘high’ and ‘extreme’ wind twist conditions, respectively. Five buildings with the aspect ratio (Height: Width) of 4:1 to 0.5:1 were tested for a number of wind incidence angles to assess the influences of building dimensions and approaching wind directions. All test cases were repeated in a conventional wind profile (CWP) with similar mean wind speeds and turbulence intensities for the purpose of comparison. The wind tunnel test results reveal that pedestrian-level wind environments in TWPs are different than in CWPs owe to asymmetric wind fields, displaced flow features, and variations in areas of high and low wind speeds. The increased areas of low wind speeds and displaced downstream far-field low wind speed (DFLWS) zone are the two important flow modifications that would have negative impacts on outdoor thermal comfort and air pollutant dispersion in built-up areas where TWPs exist. Due to the embedded wind twist angles, wind incidence angles have different effects on flow modifications in twisted wind profiles than in conventional wind profiles.
Read more
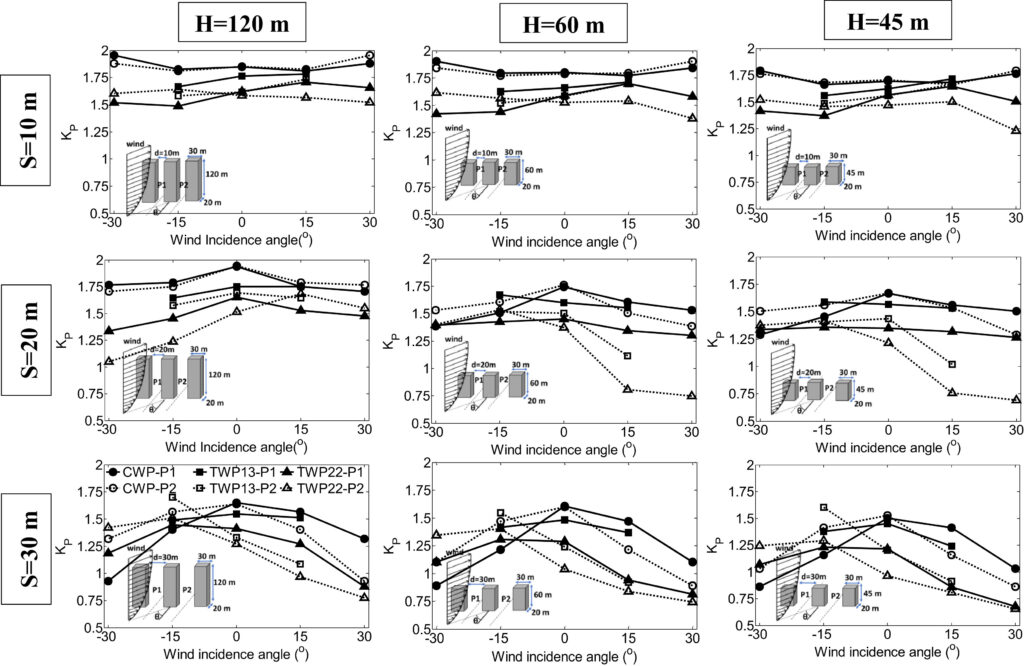
Effects of twisted wind flows on wind conditions in passages between buildings
The hilly terrain in Hong Kong detour winds and generate twisted wind profiles, which have varying wind directions along the profile’s height. Twisted winds considerably influence the wind environments in built-up areas. Particularly the wind conditions around building arrays have paramount importance in Hong Kong as most of the building arrays are closely-spaced tall residential towers with some recreational areas located at buildings’ lower levels. This paper aims at the systematic investigation of the surrounding wind conditions of building arrays in twisted wind flows by a series of wind tunnel tests. There were 9 building models with different heights and passage widths tested in two twisted wind profiles at a number of wind incidence angles. Each model had three identical buildings and two similar passages among buildings. The observed wind environments in twisted wind flows were asymmetric near building arrays and wind speeds were dissimilar in the two passages. Compared to the building height, the passage width has more significant influences on wind conditions in passages in twisted wind flows. The effective wind direction, which is the vector summation of wind twist and wind incidence angle, is important in understanding the influence of approaching wind directions of twisted wind flows
Read more
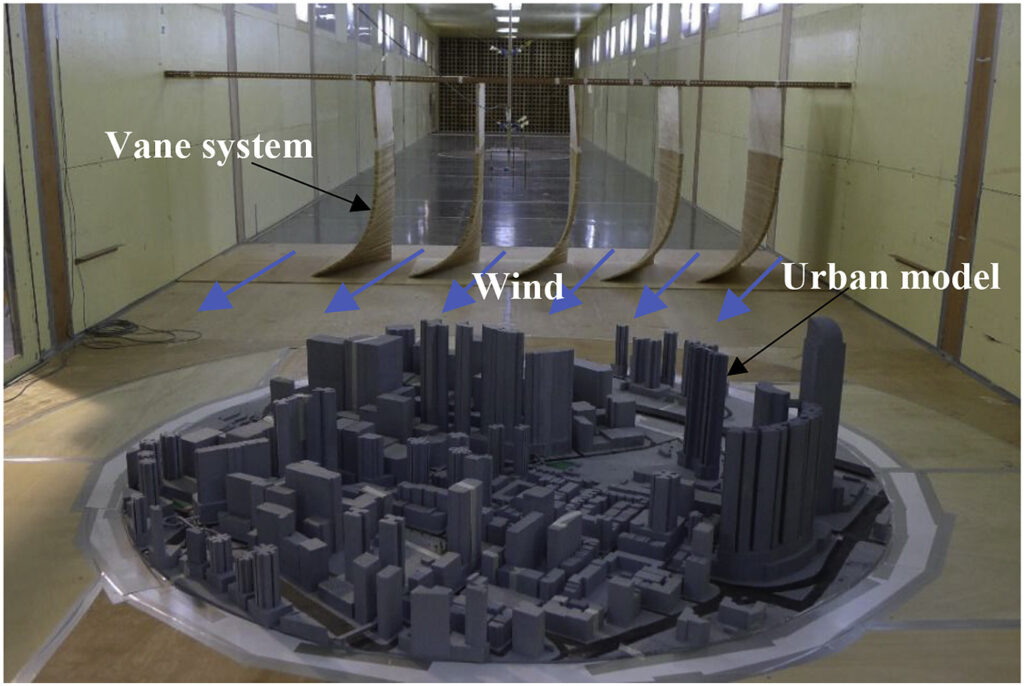
Effects of twisted wind flows on the pedestrian-level wind field in an urban environment
The influence of twisted wind flows on the pedestrian-level wind (PLW) field of an urban area was evaluated by testing a typical urban site (Tsuen Wan, Hong Kong) in a boundary layer wind tunnel. Four twisted wind profiles with different magnitudes and directions of yaw angles were employed to investigate variations in wind speed with the properties of the twisted wind flows at the pedestrian level. An additional conventional wind profile with similar wind speeds and turbulence intensities to the twisted winds but with zero yaw angles was simulated for comparisons. The mean wind speeds at 77 locations including the perimeter, roadsides, and groups of high-rise buildings were analysed for the conventional and the four twisted wind flows. The comparisons show a tendency of twisted winds to generate higher wind speeds at the pedestrian level than the conventional wind profile. The wind speeds of the twisted winds have a strong dependence on the magnitude and direction of the yaw angles, particularly at locations where the densities of buildings in the neighbourhood are low and hence local wind circulations are significantly modified by the twisted winds.
Read more
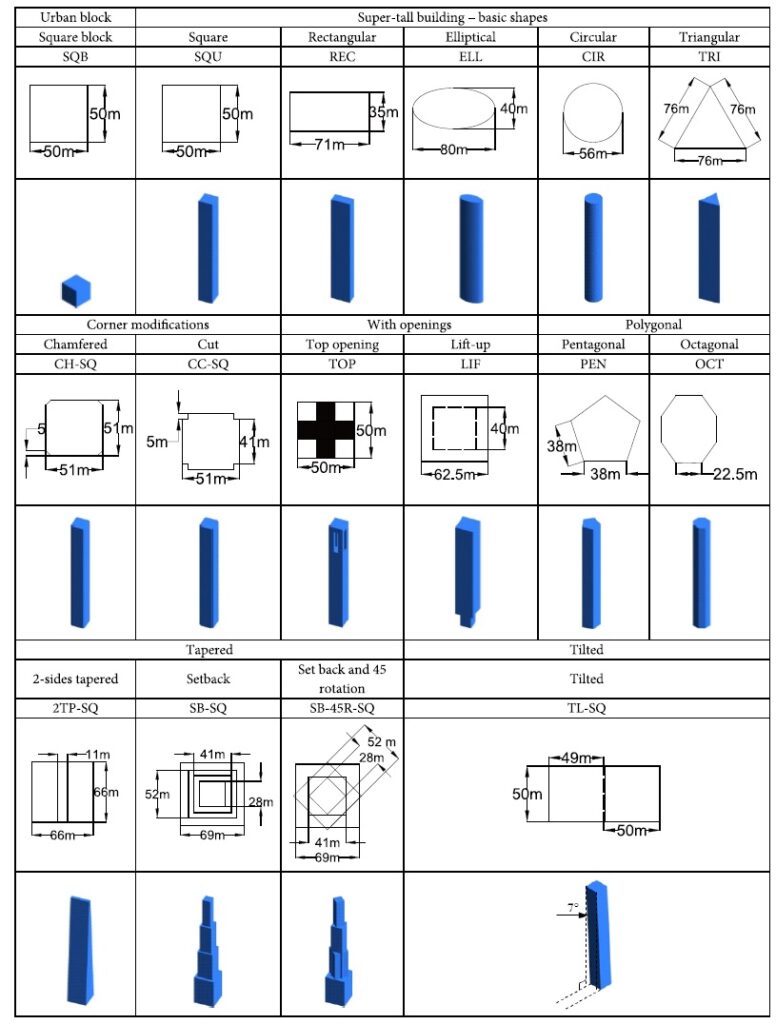
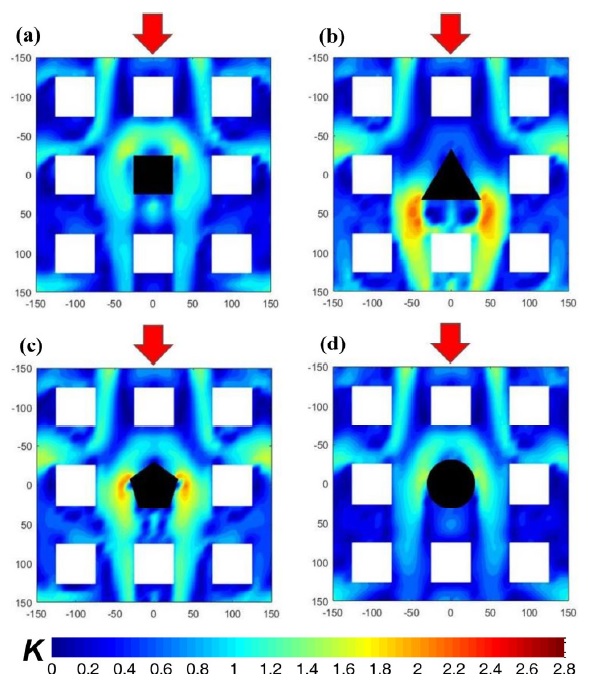
Pedestrian-level wind environment near super-tall buildings
Unconventional configurations of tall buildings are noticeably different from their counterpart of traditional building designs but nevertheless, the unconventional configurations have often been adopted for tall buildings without their impact on the pedestrian-level wind environment (PLWE) fully understood. To fill the existing knowledge gap, this study investigates the PLWE near a 400 m super-tall building with various conventional and unconventional configurations in a regular urban area. Computational fluid dynamics (CFD) simulations were conducted for three incident wind directions (θ = 0°, 22.5°, and 45°) to investigate mean wind speed at the pedestrian level using the three-dimensional (3D), steady-state, Reynolds-averaged Navier-Stokes (RANS) technique. The results reveal 1.5- to 2.5-fold increase in maximum wind speed in the urban area after the construction of a super-tall building. The magnitude of the maximum wind speed and areas with high and low wind speeds in the PLWE, however, significantly vary with building design and incident wind direction. The configurations with sharp corners, large plan aspect ratios and frontal areas and the orientation consistently show a strong dependency on incident wind direction except the one with rounded plan shapes. The location of building openings and direction of building inclination are two other factors that modify the PLWE in an urban area. Moreover, the projected width of the super-tall building at a height slightly above the roof level of surrounding buildings is critical for estimating the areas of high and low wind speed at the pedestrian level.
Read more
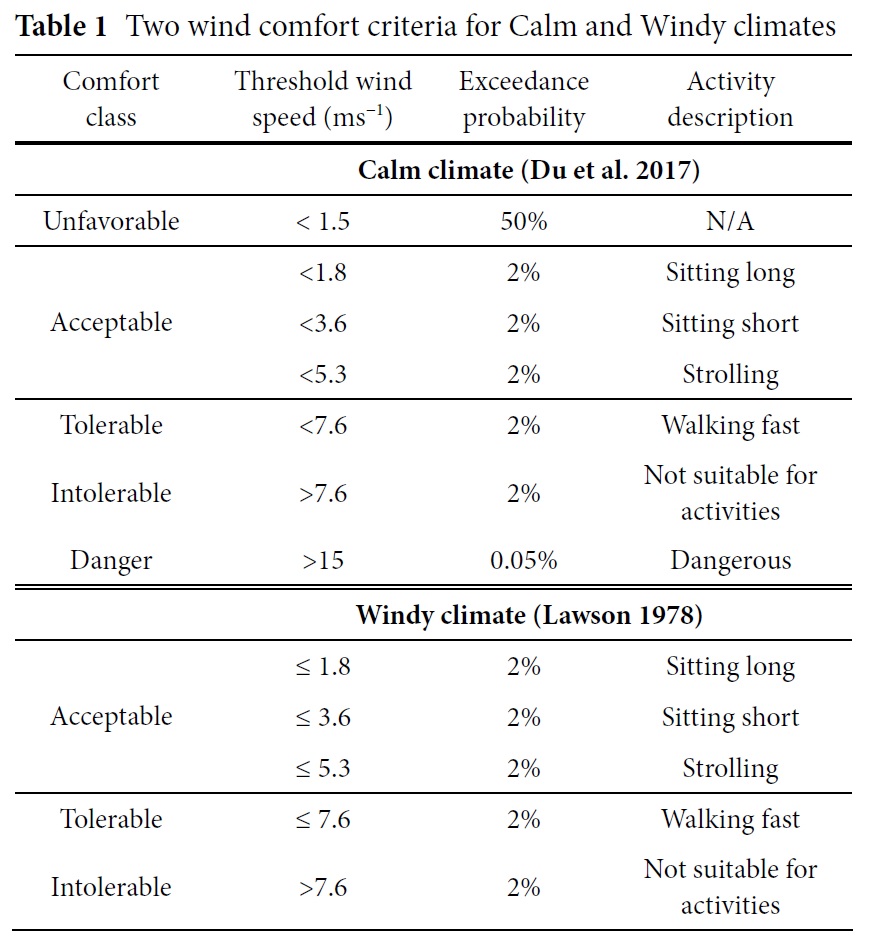
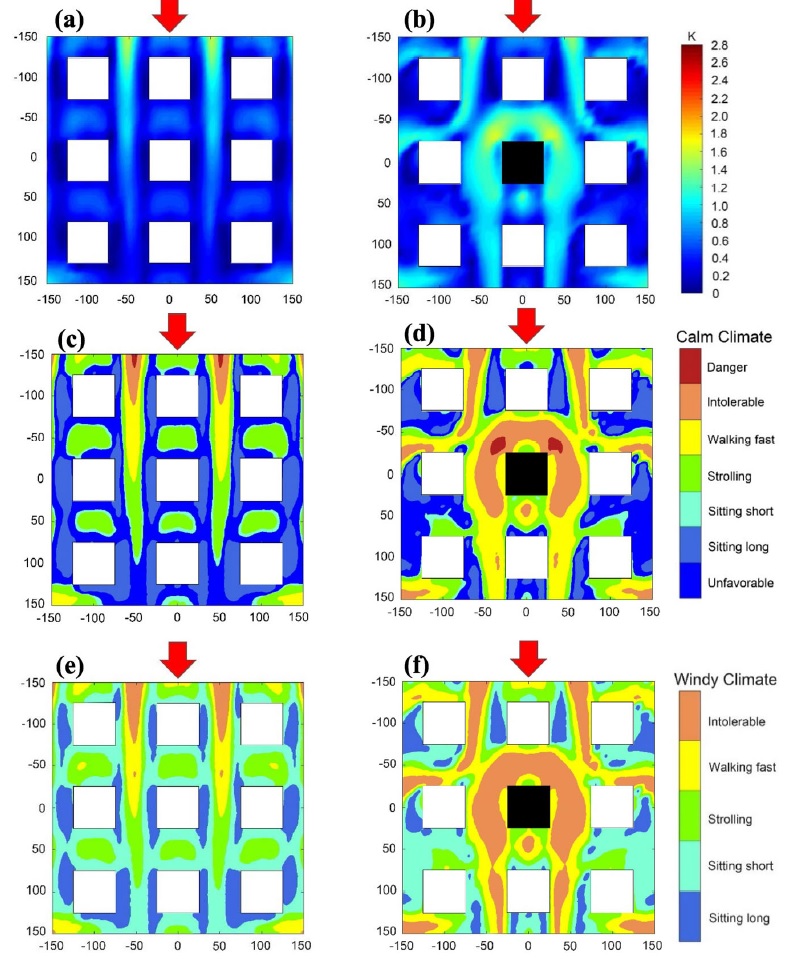
Pedestrian wind comfort near super-tall buildings in ‘windy’ and ‘calm’ wind climates
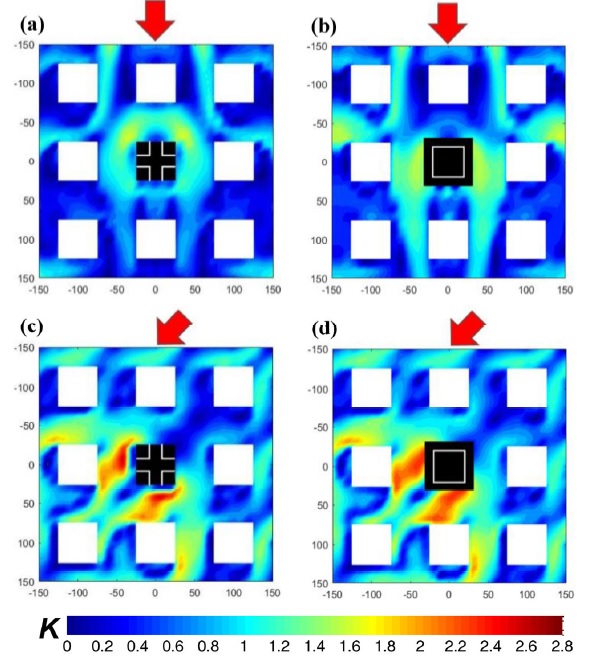
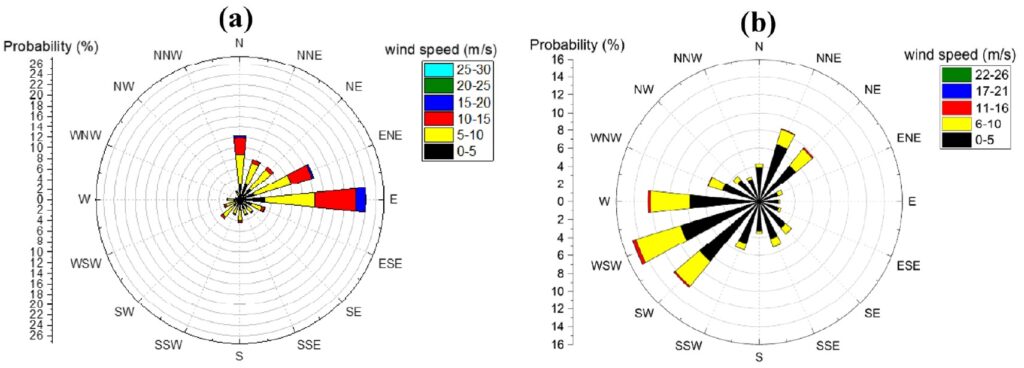
Pedestrian wind comfort near a 400 m super-tall building in high and low ambient wind speeds, referred to as Windy and Calm climates, is evaluated by conducting computational fluid dynamics (CFD) simulations. The super-tall building has 15 different configurations and is located at the center of 50 m medium-rise buildings in an urban-like setting. Pedestrian level mean wind speeds near the super-tall building is obtained from three-dimensional (3D), steady-state, Reynolds-Averaged Navier-Stokes (RANS)-based simulations for five incident wind directions (θ = 0°, 22.5°, 45°, 90°, 180°) that are subsequently compared with two wind comfort criteria specified for Calm and Windy climates. Results show a 1.53 times increase in maximum mean wind speed in the urban area after the construction of a square-shaped super-tall building. The escalated mean wind speeds result in a 23%–15% and 36%–29% decrease in the area with “acceptable wind comfort” in Calm and Windy climates, respectively. The area with pedestrian wind comfort varies significantly with building configuration and incident wind direction, for example, the configurations with sharp corners, large plan aspect ratios and, frontal areas and the orientation consistently show a strong dependency on incident wind direction except for the one with rounded plan shapes. Minor aerodynamic modifications such as corner modifications and aerodynamically-shaped configurations such as tapered and setback buildings show promise in improving pedestrian wind comfort in Windy climate.
Read more
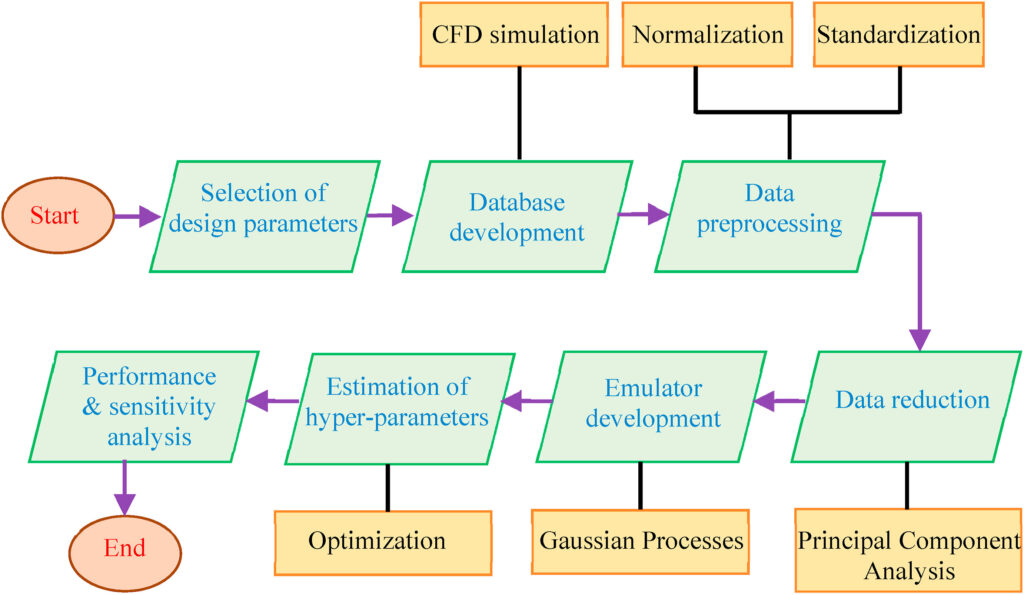
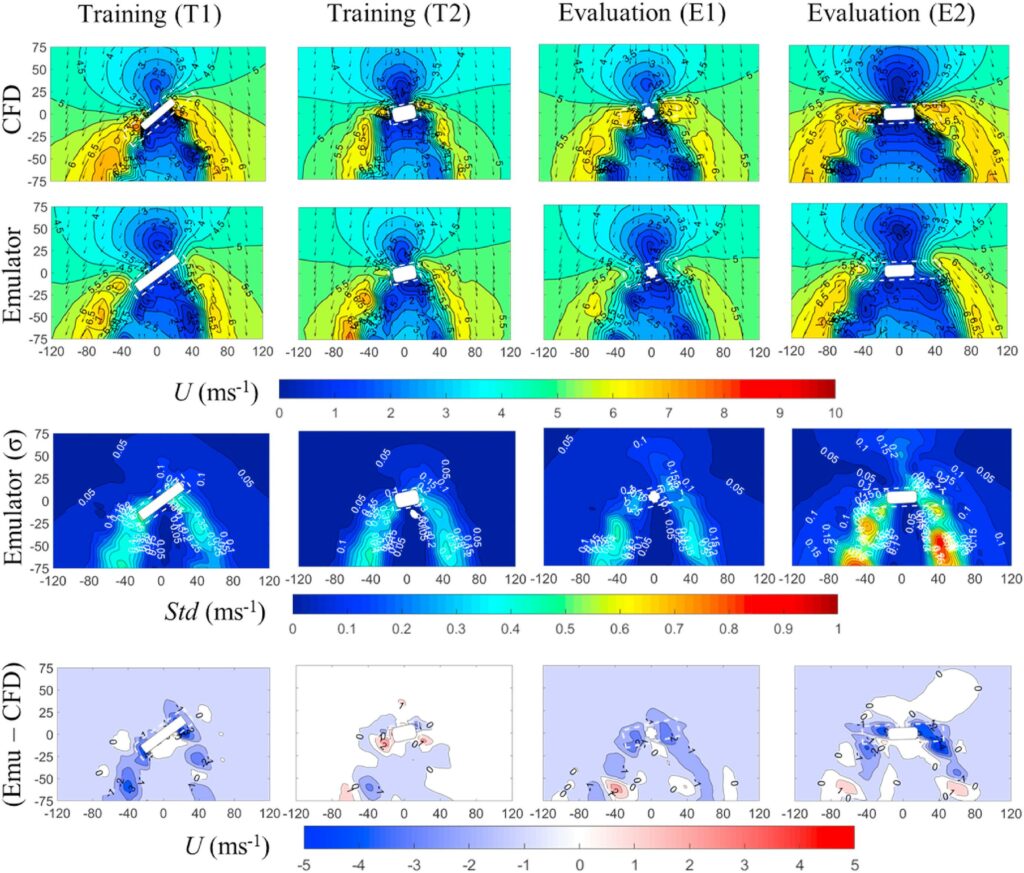
A Gaussian Process-Based emulator for modeling pedestrian-level wind field
Wind tunnel tests and computational fluid dynamics (CFD) simulations remain the main modeling techniques in wind engineering despite being expensive, time-consuming, and requiring special facilities and expert knowledge. There is a clear need for a fast, accurate, but, at the same time, computationally economical substitute. This study proposes a Gaussian Process-based (GP-based) emulator to predict the pedestrian-level wind environment near a lift-up building – an isolated, unconventionally configured building. The proposed GP-based emulator transcends the limitations of previous emulators as it can handle many inputs (8) and output parameters (384) and a large dataset (150 CFD simulations). To increase computational efficiency, the current study proposes a data reduction method based on Principal Component Analysis (PCA) and a technique to estimate hyper-parameters based on optimization. The latter can efficiently compute 250 hyper-parameters and requires no prior knowledge of their probability distributions. The emulator is faster, by a factor of 107 than CFD simulations in predicting wind speeds, and its accuracy is substantiated using both qualitative and quantitative analyses, which reveal that the emulator’s predictions of all-prominent flow features near a building have no systematic bias, are highly accurate, and have great reproductivity.